- Georgia counted 7,803,239 international traveller trips in 2025, up 5.9%. Of these, 6,856,809 were visitor trips and 5,521,866 were tourist (overnight) trips (GNTA, from border data).
- International tourism receipts reached $4.69 billion in 2025 (National Bank of Georgia), and tourism's share of GDP was 7.4% (Geostat).
- Russia (1.58 million visitor trips), Türkiye (1.25 million) and Armenia (0.95 million) led in 2025. China (+44%) and Israel (+29%) grew fastest among the top 15.
- From January to June 2026, traveller trips fell 3.3% to 3,050,173, while tourist trips rose 0.1% to 2,272,964. Receipts for January to September 2026 were $3.80 billion, up 4.4%.
- In 2025 the average visit lasted 5.6 nights and cost 2,187 GEL, and 93.7% of visitors were satisfied or very satisfied (Geostat).
These Georgia tourism statistics come straight from the official sources. In 2025, Georgia (the country) recorded 7,803,239 international traveller trips, 5.9% more than in 2024. Of these, 5,521,866 were tourist trips with at least one night's stay. Visitors brought in $4.69 billion, and tourism industries made up 7.4% of GDP. Trips are still below the 2019 peak of 9.36 million. Yet overnight stays and income are now higher than in 2019.
Below you will find the headline numbers for 2019 and 2023 to 2025, then the latest 2026 quarters. After that come top source countries, borders and airports, the busiest months, spending, where visitors go, protected areas and satisfaction. Every figure names its body and its period: GNTA, Geostat, the National Bank of Georgia, the Civil Aviation Agency or the Agency of Protected Areas. We last checked the sources on 28 October 2026 and update the page each quarter.
Georgia tourism statistics at a glance: 2019 and 2023 to 2025
The table covers full calendar years. Trip counts are border crossings logged by the Ministry of Internal Affairs. The Georgian National Tourism Administration (GNTA) puts them out. Receipts are the National Bank of Georgia's balance-of-payments figure for international travel. The GDP share is Geostat's estimate for tourism industries. Spending and nights come from Geostat's survey of visitors as they leave the country.
| Indicator (full year, source) | 2019 | 2023 | 2024 | 2025 |
|---|---|---|---|---|
| International traveller trips (GNTA) | 9,357,964 | 7,072,220 | 7,368,149 | 7,803,239 |
| International visitor trips (GNTA) | 7,725,774 | 6,171,540 | 6,456,064 | 6,856,809 |
| Tourist (overnight) trips (GNTA) | 5,080,478 | 4,669,467 | 5,091,732 | 5,521,866 |
| Same-day trips (GNTA) | 2,645,296 | 1,502,073 | 1,364,332 | 1,334,943 |
| International tourism receipts (NBG) | $3.27 billion | $4.13 billion | $4.43 billion | $4.69 billion |
| Tourism share of GDP (Geostat) | 8.4% | 7.1% | 7.3% | 7.4% |
| Average spend per visit (Geostat) | 1,102 GEL | 2,097 GEL | 2,211 GEL | 2,187 GEL |
| Average length of stay (Geostat) | 4.1 nights | 5.4 nights | 5.5 nights | 5.6 nights |
The trend in short
Trips have not returned to the 2019 record, but overnight stays and income have passed it. In 2025, traveller trips were about 17% below 2019. Tourist trips were about 9% above it, and receipts about 43% higher (our sums from the table). Most of the gap is same-day trips, which fell by half. Those short hops come mainly from neighbouring countries. Visits also got longer, from 4.1 nights in 2019 to 5.6 in 2025.
Traveller, visitor or tourist trip: what Georgia visitor numbers count
Georgia follows the UN Tourism definitions, so one year produces three very different totals. Most confusion in headlines comes from mixing them up. Here is what each term means, in plain words.
- Traveller trip: any entry by a non-resident, of any age and for any reason. Georgian citizens who live abroad count too. This is the widest number.
- Visitor trip: a traveller trip by someone aged 15 or over, outside their usual environment, who is not coming to work for a local employer. GNTA treats anyone who crosses eight or more times as being in their usual environment, so regular border commuters drop out.
- Tourist (overnight) trip: a visitor trip with at least one night in Georgia.
- Same-day trip: a visitor trip with no night in the country.
- Other (non-tourist) trips: the rest, mostly children under 15 and frequent crossers.
Two more traps catch people out. First, these are trips, not people. Someone who comes three times in a year counts three times. Geostat also counts individual visitors, and that number is always lower. Second, airport passenger totals include everyone who flies in or out, Georgians too. They are not visitor numbers.
Tourism in Georgia in 2026 so far: the latest quarters
When we checked on 28 October 2026, GNTA had full 2026 data up to June. Each figure below is compared with the same months of 2025.
| Indicator (source) | Q1 2026 (Jan-Mar) | Q2 2026 (Apr-Jun) | H1 2026 (Jan-Jun) |
|---|---|---|---|
| International traveller trips (GNTA) | 1,300,505 (-1.1%) | 1,749,668 (-4.9%) | 3,050,173 (-3.3%) |
| International visitor trips (GNTA) | 1,170,362 (-0.2%) | 1,564,142 (-4.5%) | 2,734,504 (-2.7%) |
| Tourist (overnight) trips (GNTA) | 997,529 (+4%) | 1,275,435 (-2.7%) | 2,272,964 (+0.1%) |
| Tourism receipts (NBG) | $829.8 million (+0.5%) | $1,101.8 million (-3.8%) | $1,931.7 million (-2%) |
| Average spend per visit (Geostat) | 1,897 GEL (-5.1%) | 1,922 GEL (-9.2%) | 1,911 GEL |
| Average length of stay (Geostat) | 5.9 nights | 5.5 nights | 5.6 nights |
Third quarter of 2026: first figures
The National Bank's figure for July to September 2026 is already out. GNTA's economic indicators file, posted on 20 October 2026, puts Q3 receipts at $1.86 billion. That is 11.9% more than in Q3 2025. Receipts for January to September reached $3.80 billion, up 4.4%.
Trip counts for Q3 had not reached gnta.ge by 28 October. Georgia Times reported GNTA figures on 27 October 2026: 6,112,078 international visits from January to September, up 0.04%. That total lines up with the traveller-trip series, so it is the widest measure. The same report gave 119,081 visits from China, a nine-month record and 23.6% more than a year earlier.
Record or fall? Why 2026 headlines disagree
In July 2026, two official sources seemed to say opposite things. GNTA called the half-year a record: 2,272,964 tourist (overnight) trips from January to June, up 0.1%. Ten days later, Geostat reported that international visitors fell 5.2% in April to June.
Both are right, because they count different things over different periods. GNTA's record covers overnight trips across six months. Geostat's 5.2% fall covers individual people in one quarter: about 1.3 million visitors, who made about 1.56 million visits (-4.5%). GNTA's own counts for that quarter also fell, with traveller trips down 4.9% and tourist trips down 2.7%.
One more catch for anyone citing the half-year report. Its cover labels the 2.3 million figure as 'visitor trips'. The text inside shows it is the tourist-trip count. Visitor trips for the half-year were 2,734,504, down 2.7%.
How many tourists visit Georgia, and from which countries?
Neighbouring countries still dominate. In 2025 they made 59.3% of visitor trips, with Russia at 23%, Türkiye at 18% and Armenia at 14%. Visitors from further away stay overnight far more often. A night was part of 95.1% of their trips, against 70.6% for neighbours (GNTA, Georgian Tourism in Figures 2025).
| Country | Visitor trips 2025 | Change on 2024 | Tourist (overnight) trips 2025 | Change on 2024 |
|---|---|---|---|---|
| Russia | 1,579,764 | +11.1% | 1,239,314 | +11.3% |
| Türkiye | 1,248,881 | -6.6% | 878,104 | +3.3% |
| Armenia | 948,242 | 0.0% | 524,489 | -0.3% |
| Israel | 402,426 | +29.4% | 374,106 | +30.4% |
| Azerbaijan | 292,149 | +33.2% | 230,076 | +20.8% |
| Kazakhstan | 169,367 | -5.3% | 157,101 | -7.0% |
| Belarus | 150,325 | +7.0% | 142,522 | +6.6% |
| India | 142,476 | +14.6% | 141,132 | +14.6% |
| Ukraine | 136,826 | +15.4% | 129,057 | +15.6% |
| China | 127,895 | +44.4% | 122,184 | +42.5% |
| Iran | 120,068 | -17.6% | 118,066 | -17.7% |
| Saudi Arabia | 96,340 | +9.1% | 93,902 | +10.0% |
| Germany | 83,656 | +6.4% | 79,283 | +6.8% |
| Poland | 79,722 | +19.9% | 77,888 | +20.5% |
| Uzbekistan | 72,913 | +13.5% | 67,963 | +10.5% |
| EU + United Kingdom (all) | 499,890 | +14.0% | n/a | n/a |
| United Kingdom | 45,018 | +39.1% | n/a | n/a |
| Gulf countries (all) | 145,513 | +3.4% | n/a | n/a |
Source: GNTA, from Ministry of Internal Affairs border data, full year 2025. The EU + UK row covers all 27 EU members plus the United Kingdom. Germany, Poland and the UK led that group.
Top countries from January to June 2026
| Country | Visitor trips Jan-Jun 2025 | Visitor trips Jan-Jun 2026 | Change |
|---|---|---|---|
| Russia | 581,099 | 610,825 | +5.1% |
| Türkiye | 533,614 | 525,380 | -1.5% |
| Armenia | 390,788 | 360,050 | -7.9% |
| Israel | 171,294 | 146,628 | -14.4% |
| Azerbaijan | 135,248 | 133,345 | -1.4% |
| Ukraine | 56,461 | 69,250 | +22.7% |
| Kazakhstan | 62,713 | 66,526 | +6.1% |
| China | 46,755 | 54,554 | +16.7% |
| Belarus | 46,248 | 46,220 | -0.1% |
| Germany | 32,392 | 40,892 | +26.2% |
| Poland | 33,658 | 39,506 | +17.4% |
| India | 75,893 | 30,554 | -59.7% |
| Iran | 57,292 | 29,397 | -48.7% |
| Uzbekistan | 29,376 | 28,213 | -4.0% |
| USA | 22,224 | 23,191 | +4.4% |
| EU + United Kingdom (all) | n/a | 249,201 | +23.4% |
| Gulf countries (all) | n/a | 26,397 | -44% |
Source: GNTA half-year overview 2026. GNTA linked the falls from India, Iran, Israel and the Gulf to the conflict in the region and the flight cancellations that followed. Trips from the EU and UK hit a record 249,201, with Germany, Poland and Italy (+41.8%) adding the most trips. Two country labels are swapped in the table of GNTA's PDF. The rows here follow GNTA's own text.
How visitors arrive: borders, flights and the busiest airports
Most visitors still come overland, but air travel is gaining ground. In 2025, 57.6% of visitor trips crossed a land border and 41.6% came by air. Rail and sea together made under 1% (GNTA). In the first half of 2026, air reached 43.6% of visitor trips.
| Border crossing | Border with | Visitor trips 2024 | Visitor trips 2025 |
|---|---|---|---|
| Tbilisi International Airport | air | 1,599,984 | 1,867,086 |
| Sarpi | Türkiye | 1,311,190 | 1,212,743 |
| Kazbegi (Upper Lars) | Russia | 1,116,302 | 1,141,820 |
| Sadakhlo | Armenia | 830,743 | 887,030 |
| Batumi International Airport | air | 399,624 | 521,325 |
| Kutaisi International Airport | air | 439,188 | 466,001 |
| Ninotsminda | Armenia | 196,621 | 235,877 |
| Red Bridge (Tsiteli Khidi) | Azerbaijan | 139,300 | 139,594 |
| Kartsakhi | Türkiye | 149,422 | 113,381 |
| Guguti | Armenia | 75,791 | 79,111 |
| Vale | Türkiye | 89,172 | 76,876 |
| Tsodna | Azerbaijan | 61,311 | 65,377 |
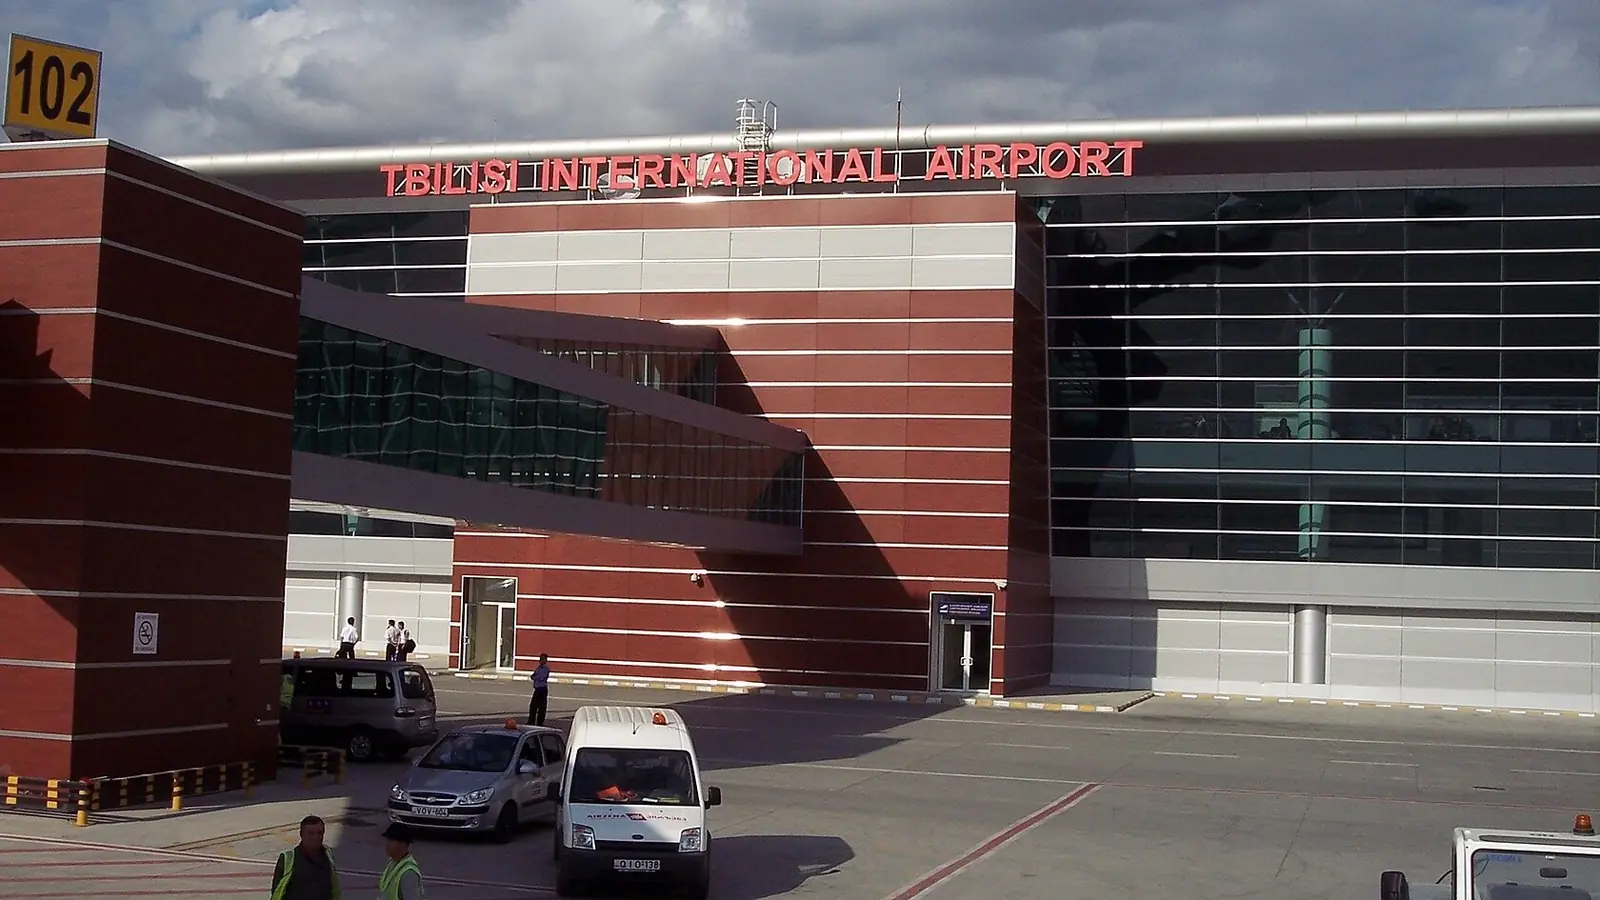
Tbilisi airport has been the busiest way in since 2024, when it passed Sarpi. In 2025 it handled 27.2% of all visitor trips (GNTA). The figures above are entries into Georgia. Azerbaijan has kept its own land border closed to most incoming travellers since 2020, so check the rules before you plan a crossing.
Airport passengers by airport (Civil Aviation Agency)
| Airport | Passengers 2024 | Passengers 2025 | Change | Jan-Jun 2026 | Change on Jan-Jun 2025 |
|---|---|---|---|---|---|
| Tbilisi | 4,750,425 | 5,414,762 | +14.0% | 2,335,254 | -1.0% |
| Kutaisi | 1,722,804 | 1,824,720 | +5.9% | 842,350 | +1.0% |
| Batumi | 951,766 | 1,230,200 | +29.3% | 411,546 | -8.6% |
| Natakhtari | 13,854 | 13,230 | -4.5% | 5,738 | -2.0% |
| Mestia | 9,991 | 10,059 | +0.7% | 4,449 | -7.1% |
| Ambrolauri | 1,812 | 1,669 | -7.9% | 642 | +1.1% |
These counts include every passenger who flew in or out, Georgians as well as visitors. GNTA gives a national total of 8,481,410 airport passengers for 2025. Batumi grew fastest that year but slipped in early 2026. Our guides to Tbilisi airport, Kutaisi airport and Batumi airport cover terminals, transfers and buses. For the routes themselves, see our list of direct flights to Georgia.
Busiest months: Georgia visitor numbers by season
No official body publishes monthly arrivals by country. Monthly airport traffic is the best public guide to the season. In 2025, August was the peak with just over 1 million passengers, and February was the quietest month.
| Month (2025) | Airport passengers, all airports | Share of the year |
|---|---|---|
| January | 529,575 | 6.2% |
| February | 464,956 | 5.5% |
| March | 542,622 | 6.4% |
| April | 648,968 | 7.7% |
| May | 702,529 | 8.3% |
| June | 759,676 | 9.0% |
| July | 945,361 | 11.1% |
| August | 1,033,319 | 12.2% |
| September | 852,387 | 10.1% |
| October | 765,698 | 9.0% |
| November | 606,102 | 7.1% |
| December | 630,217 | 7.4% |
Source: Civil Aviation Agency, published by GNTA. Border data tell the same story. July to September 2025 brought 2,956,014 traveller trips, 37.9% of the year. January to March brought 1,314,828, or 16.8%. Branded hotels were 79% full in August 2025 and about 36% full in January and February (STR data published by GNTA).
Georgia tourism revenue and visitor spending
Two official measures exist, and they should not be added together. The National Bank's international travel receipts are a balance-of-payments figure in US dollars. Geostat's exit survey asks departing visitors what they spent, in lari (GEL).
Tourism receipts by quarter (National Bank of Georgia)
| Period | 2024 | 2025 | 2026 | Change 2026 on 2025 |
|---|---|---|---|---|
| Q1 (Jan-Mar) | $807.7 million | $826.0 million | $829.8 million | +0.5% |
| Q2 (Apr-Jun) | $1,090.7 million | $1,145.0 million | $1,101.8 million | -3.8% |
| Q3 (Jul-Sep) | $1,563.3 million | $1,666.8 million | $1,864.4 million | +11.9% |
| Q4 (Oct-Dec) | $963.7 million | $1,052.4 million | not yet published | n/a |
| Full year or year to date | $4,425.4 million | $4,690.2 million | $3,796.1 million (Jan-Sep) | +4.4% (Jan-Sep) |
In the first half of 2026, the EU and UK together brought the most money: $336 million, or 17.4%. Russia followed with $307 million, then Türkiye with $255 million and Israel with $223 million (NBG, in GNTA's half-year overview).
What visitors spend their money on (Geostat)
Visitors spent about 15.0 billion GEL in 2025, or 2,187 GEL per visit. Holiday trips averaged 2,703 GEL and business trips 935 GEL. Shopping was the largest single item for the year.
| Spending item | Share in 2025 | Share in Q2 2026 |
|---|---|---|
| Shopping | 28.4% | 25.2% |
| Accommodation | 25.4% | 24.3% |
| Food and drink served | 23.3% | 27.3% |
| Culture and entertainment | 13.0% | 10.6% |
| Local transport | 8.7% | 10.3% |
| Other | 1.2% | 2.3% |
| Total spent | about 15.0 billion GEL | about 3.0 billion GEL (-13.3%) |
| Average per visit | 2,187 GEL | 1,922 GEL (-9.2%) |
For a traveller's view of the same money, with daily budgets and real prices, see our guide to the cost of travel in Georgia.
Spending and nights by country (2025)
| Country of residence | Average spend per visit | Average nights | Interviews |
|---|---|---|---|
| Kazakhstan | 8,445 GEL | 6.5 | 216 |
| Saudi Arabia | 3,941 GEL | 6.7 | 135 |
| Israel | 3,589 GEL | 6.1 | 315 |
| United Arab Emirates | 3,239 GEL | 6.6 | 157 |
| Germany | 2,325 GEL | 6.6 | 179 |
| China | 2,173 GEL | 5.9 | 124 |
| Russia | 2,041 GEL | 6.5 | 3,066 |
| India | 1,812 GEL | 11.0 | 125 |
| Poland | 1,801 GEL | 6.2 | 78 |
| Türkiye | 1,618 GEL | 3.0 | 3,977 |
| Armenia | 972 GEL | 2.1 | 1,731 |
| Azerbaijan | 834 GEL | 3.7 | 189 |
Source: Geostat international visitor survey, 2025. Small samples swing a lot from year to year. Treat any row with fewer than about 200 interviews as a rough guide only. Kazakhstan topped the table in both 2024 and 2025.
Length of stay, trip purpose and where visitors sleep
The average visit in 2025 lasted 5.6 nights, up from 4.1 in 2019. People who fly in stay more than twice as long as those who cross by land. Half of all visits are holidays, and most visitors have been to Georgia before.
| Measure (Geostat, 2025) | Value |
|---|---|
| Average stay, all visits | 5.6 nights |
| Holiday and leisure visits | 5.9 nights |
| Visiting friends or relatives | 7.7 nights |
| Business visits | 4.9 nights |
| Arrived by air | 8.4 nights |
| Arrived by land | 3.8 nights |
| Main purpose: holiday, leisure, recreation | 50.3% |
| Main purpose: visiting friends or relatives | 23.9% |
| Main purpose: transit | 12.9% |
| Main purpose: business | 6.1% |
| Main purpose: shopping | 4.9% |
| Repeat visits | 78.4% (first visits 21.6%) |
| Came with family or relatives | 47.5% (alone 27.1%, with friends 23.1%) |
| Nights in hotels | 41.7% |
| Nights with friends or relatives | 22.5% |
| Nights in rented flats or houses | 17.7% |
| Nights in guesthouses or hostels | 5.3% |
| Visits without a package tour | 95.2% |
Repeat visits are highest among neighbours: 97.5% of Armenian and 96.9% of Azerbaijani visits were repeats. First visits were most common from the Philippines, Kuwait, China and Qatar. Most people plan the trip themselves. A previous visit was the top source of information (64.1%), ahead of friends and relatives (50.9%).
Where visitors go and what they do: Tbilisi, Batumi and the regions
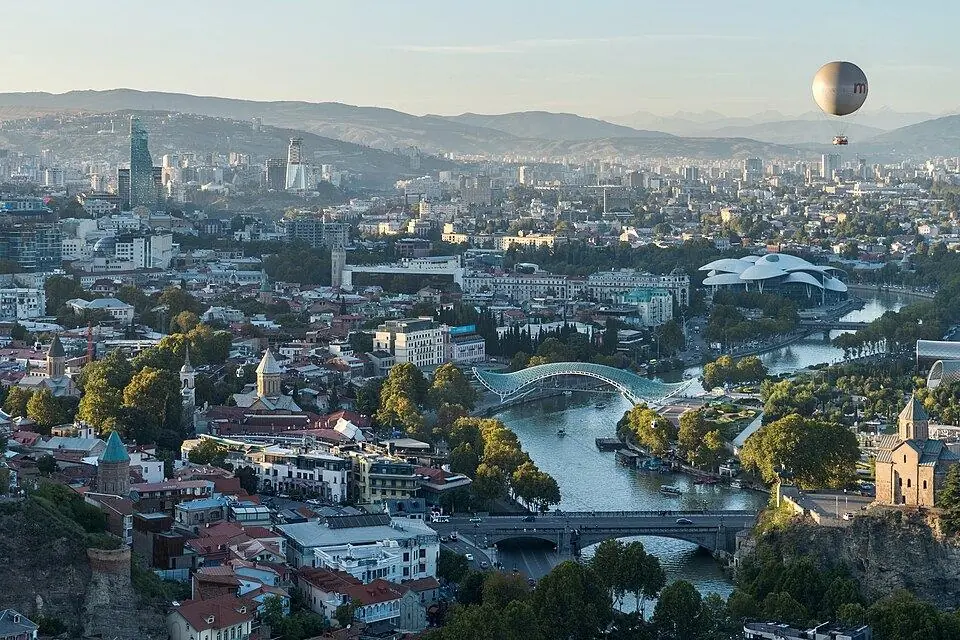
Tbilisi and the Black Sea coast lead by a wide margin. In 2025, 57% of visits included Tbilisi and 39.5% included Batumi (Geostat). Among holiday visitors, about six in ten went to Batumi, which put it ahead of the capital for that group.
| Region visited (2025) | Share of visits |
|---|---|
| Tbilisi | 57.0% |
| Adjara | 40.4% |
| Mtskheta-Mtianeti | 17.4% |
| Imereti | 10.1% |
| Kvemo Kartli | 9.4% |
| Samtskhe-Javakheti | 9.3% |
| Kakheti | 6.3% |
| Samegrelo-Zemo Svaneti | 3.0% |
| Shida Kartli | 2.5% |
| Guria | 1.6% |
| Racha-Lechkhumi and Kvemo Svaneti | 0.1% |
| Town or area visited (2025) | Share of visits |
|---|---|
| Tbilisi | 57.0% |
| Batumi | 39.5% |
| Kutaisi | 9.6% |
| Kazbegi | 9.0% |
| Mtskheta | 8.2% |
| Marneuli | 5.9% |
| Borjomi | 4.7% |
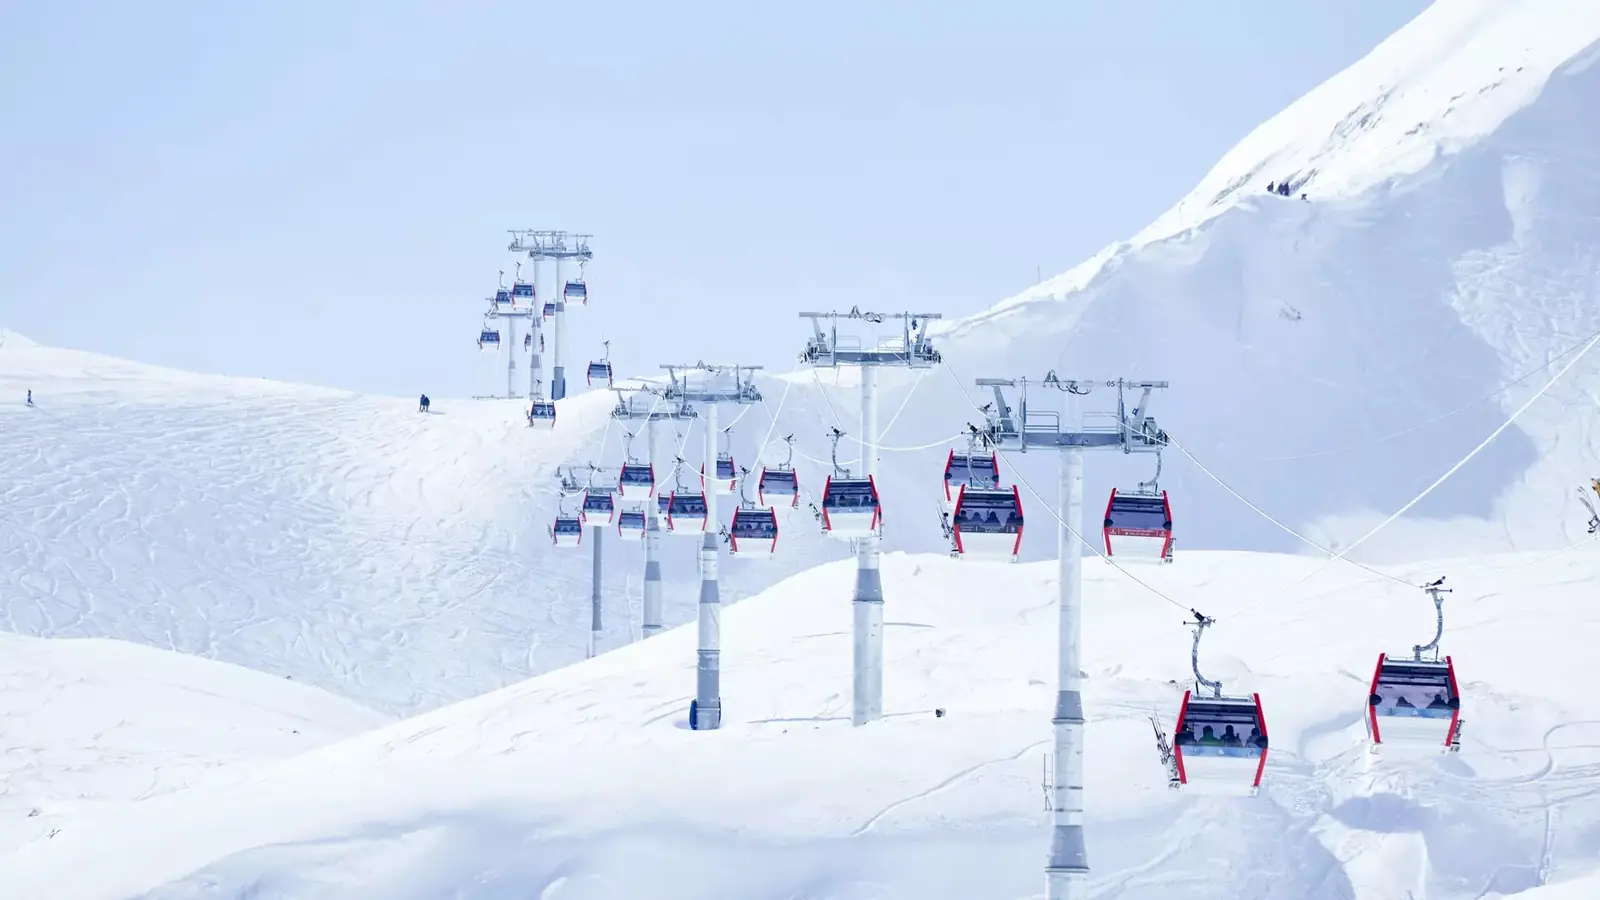
| Gudauri | 4.1% |
| Sighnaghi | 3.5% |
| Akhaltsikhe | 2.7% |
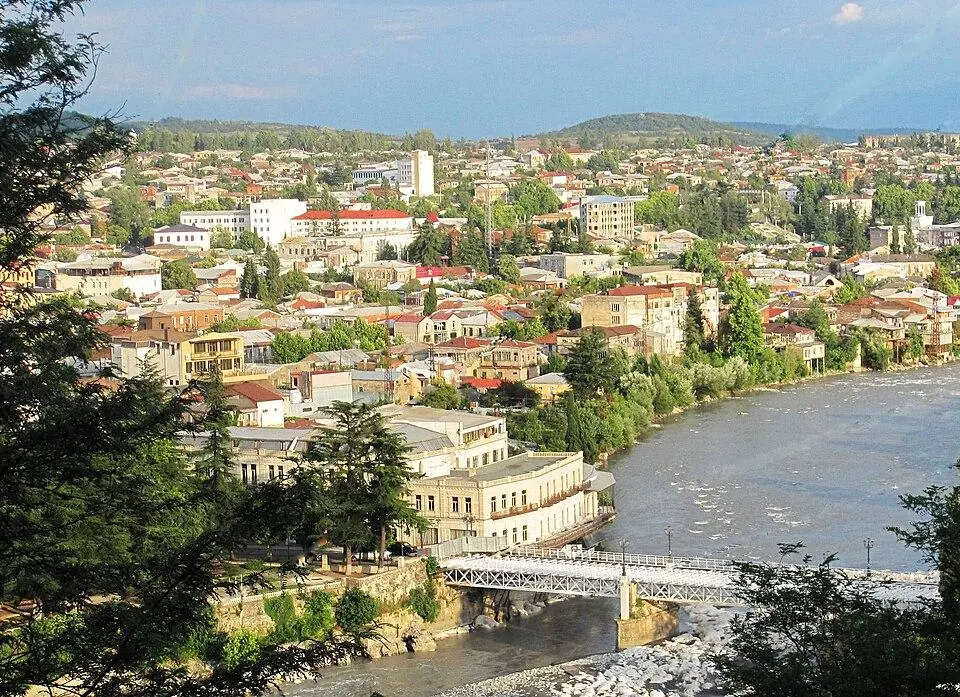
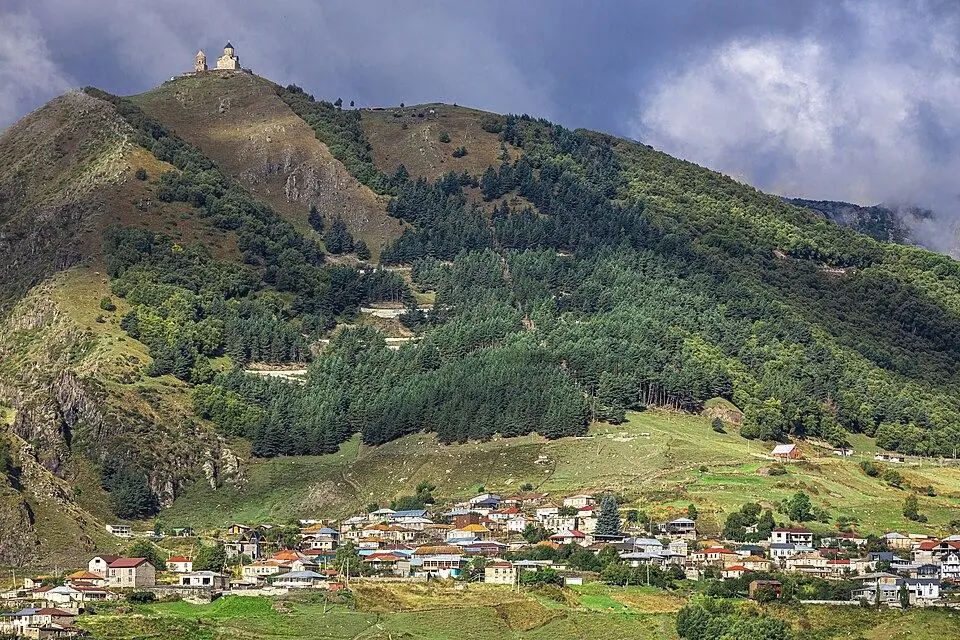
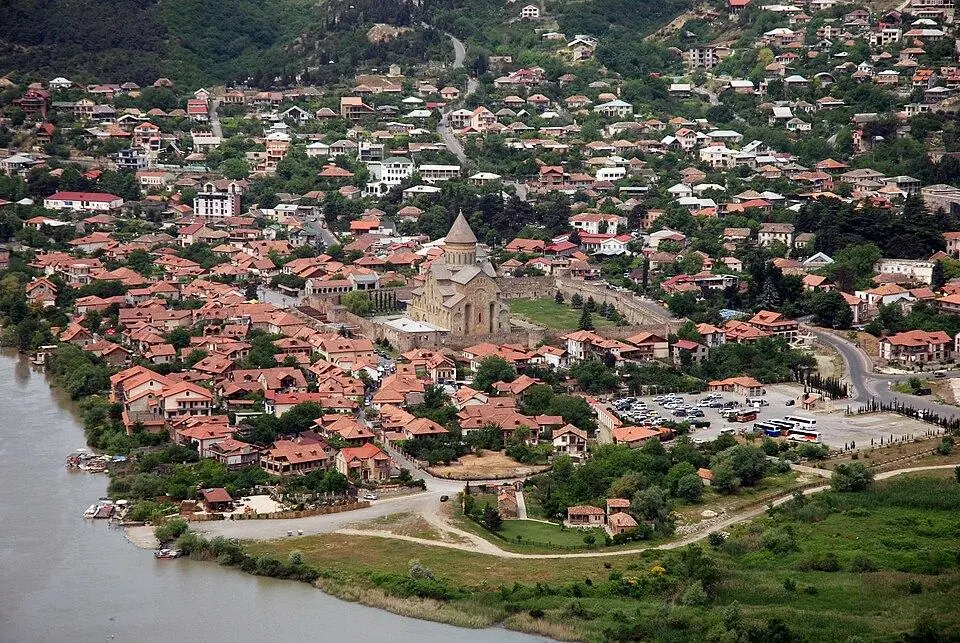
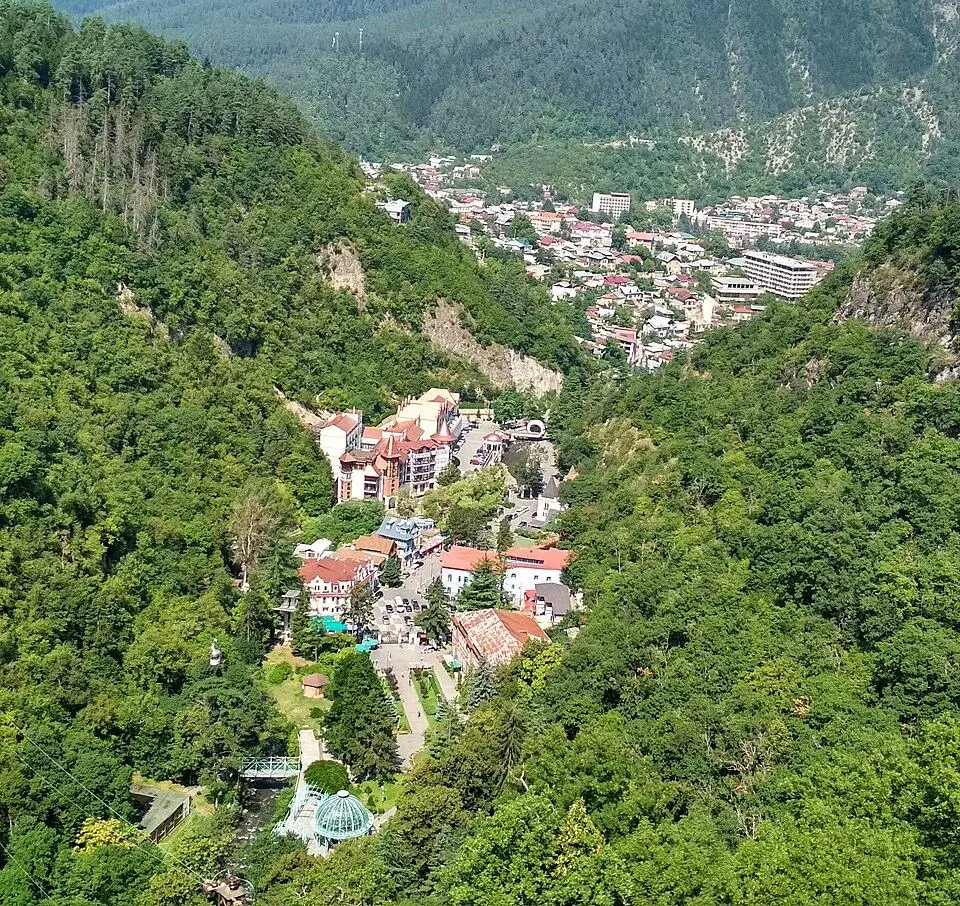
Visits can include several places, so the shares add up to more than 100%. Marneuli's 5.9% comes almost entirely from visitors from neighbouring countries. Only 0.1% of holiday visitors went there. Remote mountain areas look small in these numbers. Samegrelo-Zemo Svaneti, home to Mestia, drew 3.0% of visits, while Kazbegi, an easy drive from Tbilisi, drew 9.0%.

What visitors do
| Activity (Geostat survey) | Share of visits 2019 | Share of visits 2025 |
|---|---|---|
| Tasting Georgian food and wine | 74.8% | 88.8% |
| Shopping | 60.6% | 64.5% |
| Sightseeing, heritage sites and museums | 45.5% | 50.8% |
| Visiting friends or relatives | n/a | 31.4% |
| Churches and pilgrimage | 12.4% | 29.0% |
| Beach and swimming | 20.5% | 26.8% |
| Local art, culture and language | 9.0% | 23.3% |
| National parks and nature | 16.2% | 18.9% |
| Entertainment parks | 14.9% | 16.4% |
| Concerts, festivals and theatre | 2.7% | 9.5% |
| Gambling | 5.4% | 5.9% |
| Skiing and snowboarding | 2.4% | 2.7% |
How satisfied are visitors?
Very. In Geostat's 2025 survey, 52.8% of visitors were very satisfied and 40.9% satisfied, so 93.7% left happy. Only 0.6% were dissatisfied or very dissatisfied. The average score was 4.46 out of 5, up from 4.42 in 2019. It was 4.47 in Q2 2026. For safety in particular, read our guide: is Georgia safe?
Most visitors stay on the Tbilisi and Batumi axis. If you would like the quieter regions without the planning, we run private tours on any date, for any group size.
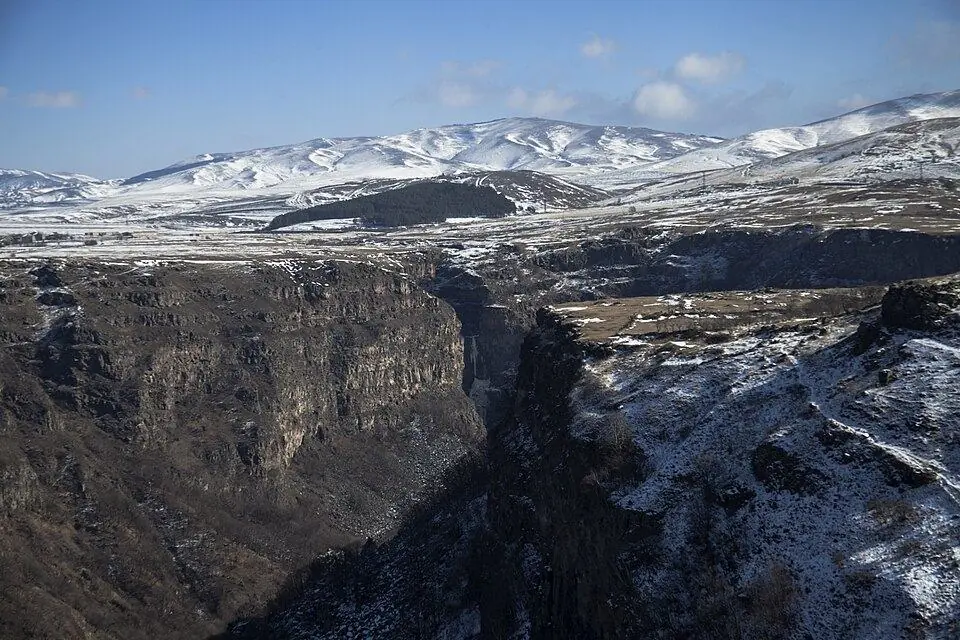
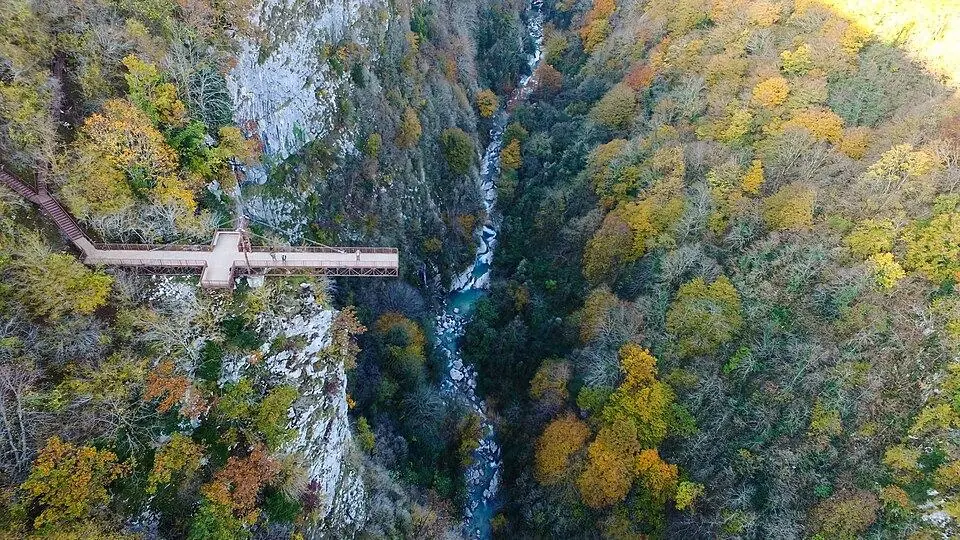
Most visited national parks and protected areas in Georgia
The Agency of Protected Areas registered 1,250,417 visits in 2025. That is up from 1,110,885 in 2024 and above the 1,199,011 of 2019. Foreign visitors made 735,229 of them, or 58.8%. Two sites in western Georgia lead by far: Prometheus Cave and Martvili Canyon.
| Rank | Protected area | Visitors 2025 | Of which foreign | Jan-Jun 2026 | Change on Jan-Jun 2025 |
|---|---|---|---|---|---|
| 1 | Prometheus Cave | 285,883 | 225,874 | 98,721 | -13.7% |
| 2 | Martvili Canyon | 275,475 | 179,516 | 63,935 | -31.4% |
| 3 | Mtirala National Park | 131,271 | 96,164 | 27,269 | -8.9% |
| 4 | Sataplia | 105,389 | n/a | 56,821 | -13.3% |
| 5 | Tsalka (Dashbashi) Canyon | 98,809 | n/a | 21,000 | -45.8% |
| 6 | Okatse Canyon | 78,295 | n/a | 24,374 | -16.2% |
| 7 | Tbilisi National Park | 54,415 | n/a | 13,850 | -40.1% |
| 8 | Borjomi-Kharagauli National Park | 49,369 | n/a | 13,627 | -16.3% |
| 9 | Kazbegi National Park | 41,065 | n/a | 16,355 | +32.5% |
| 10 | Kolkheti National Park | 20,320 | n/a | 7,241 | -6.0% |
| 11 | Algeti National Park | 20,025 | n/a | 4,274 | -23.4% |
| 12 | Tusheti Protected Areas | 19,770 | n/a | 641 | -63.3% |
| 13 | Lagodekhi Protected Areas | 16,751 | n/a | 4,123 | -4.9% |
| All protected areas | 1,250,417 | 735,229 | n/a | n/a |
Source: Agency of Protected Areas, registered visitors, published by GNTA. India sent the largest group of foreign park visitors in 2025, at 16.2%. Next came Russia with 15.6% and Poland with 10.7%, then Israel and Belarus at 7.6% each. January to June is the low season for mountain parks. The road into Tusheti only opens between late May and late June, so its half-year count stays tiny.




For what each park offers, from canyons to alpine meadows, browse our collection of national parks.
Sources, update schedule and how to cite this page
We built this page from the original files, not from press reports, except where the text says so. All the files below are on gnta.ge unless noted.
- GNTA, Georgian Tourism in Figures 2025, plus the 2019 and 2023 editions: trips, borders, countries, airports and survey summaries.
- GNTA, Statistical Data Overview for Q1, Q2 and H1 2026: 2026 trips, countries, borders and receipts by market.
- Geostat, Characteristics of International Visitors for 2025 and Q2 2026, and the survey data file to June 2026: spending, nights, purpose, places, activities and satisfaction.
- National Bank of Georgia, international travel receipts, and Geostat, tourism share of GDP: both in GNTA's economic indicators file of 20 October 2026.
- Civil Aviation Agency, passengers by airport and by month, via GNTA.
- Agency of Protected Areas: registered visits to each park and reserve, 2019 to June 2026, via GNTA.
GNTA usually posts each quarter's overview six to ten weeks after the quarter ends. We update this page when it does. The date in the byline shows our last check.
Georgia tourism statistics: frequently asked questions
How many tourists visit Georgia each year?
In 2025, Georgia recorded 5,521,866 tourist (overnight) trips. Visitor trips totalled 6,856,809 and all international traveller trips 7,803,239 (GNTA). These are trips, not people, so someone who visits twice counts twice.
Is tourism in Georgia growing in 2026?
It is roughly flat. In the first half of 2026, traveller trips were down 3.3% and overnight trips up 0.1% (GNTA). Receipts for January to September were $3.80 billion, up 4.4%, helped by a strong third quarter (National Bank of Georgia).
How much does tourism earn for Georgia?
International tourism receipts were $4.69 billion in 2025, 6% more than in 2024 (National Bank of Georgia). Tourism-related industries accounted for 7.4% of GDP, Geostat estimates. Receipts for the first half of 2026 were $1.93 billion.
Which country sends the most visitors to Georgia?
Russia, with 1,579,764 visitor trips in 2025, or 23% of the total. Türkiye and Armenia came next (GNTA). Beyond the four neighbours, Israel sent the most, and the EU and UK together made 499,890 trips.
What are Georgia's visitor numbers by month?
No body publishes monthly arrivals by country. Airport traffic peaks in August, with 1,033,319 passengers in 2025, and is lowest in February, with 464,956 (Civil Aviation Agency). July to September holds about 38% of the year's traveller trips.
What is the difference between a visitor and a tourist in Georgian statistics?
A visitor is anyone 15 or older travelling outside their normal surroundings, except people coming to work for a Georgian employer. A tourist is a visitor who stays at least one night. Visitors who leave the same day are counted as same-day visitors.
What is the most visited national park in Georgia?
Prometheus Cave had the most visitors of any protected area in 2025, 285,883, just ahead of Martvili Canyon. Both are natural monuments. The busiest national park in the strict sense was Mtirala, near Batumi, with 131,271 (Agency of Protected Areas).
When are new Georgia tourism statistics published?
GNTA posts a statistical overview each quarter, usually six to ten weeks after it ends. Geostat's visitor survey follows around the same time, and the National Bank's receipts can come earlier. We refresh this page after each release.